bvar
What is bvar?
bvar is a set of counters to record and view miscellaneous statistics conveniently in multi-threaded applications. The implementation reduces cache bouncing by storing data in thread local storage(TLS), being much faster than UbMonitor(a legacy counting library inside Baidu) and even atomic operations in highly contended scenarios. brpc integrates bvar by default, namely all exposed bvars in a server are accessible through /vars, and a single bvar is addressable by /vars/VARNAME. Read vars to know how to query them in brpc servers. brpc extensively use bvar to expose internal status. If you are looking for an utility to collect and display metrics of your application, consider bvar in the first place. bvar definitely can’t replace all counters, essentially it moves contentions occurred during write to read: which needs to combine all data written by all threads and becomes much slower than an ordinary read. If read and write on the counter are both frequent or decisions need to be made based on latest values, you should not use bvar.
To understand how bvar works, read explaining cacheline first, in which the mentioned counter example is just bvar. When many threads are modifying a counter, each thread writes into its own area without joining the global contention and all private data are combined at read, which is much slower than an ordinary one, but OK for low-frequency logging or display. The much faster and very-little-overhead write enables users to monitor systems from all aspects without worrying about hurting performance. This is the purpose that we designed bvar.
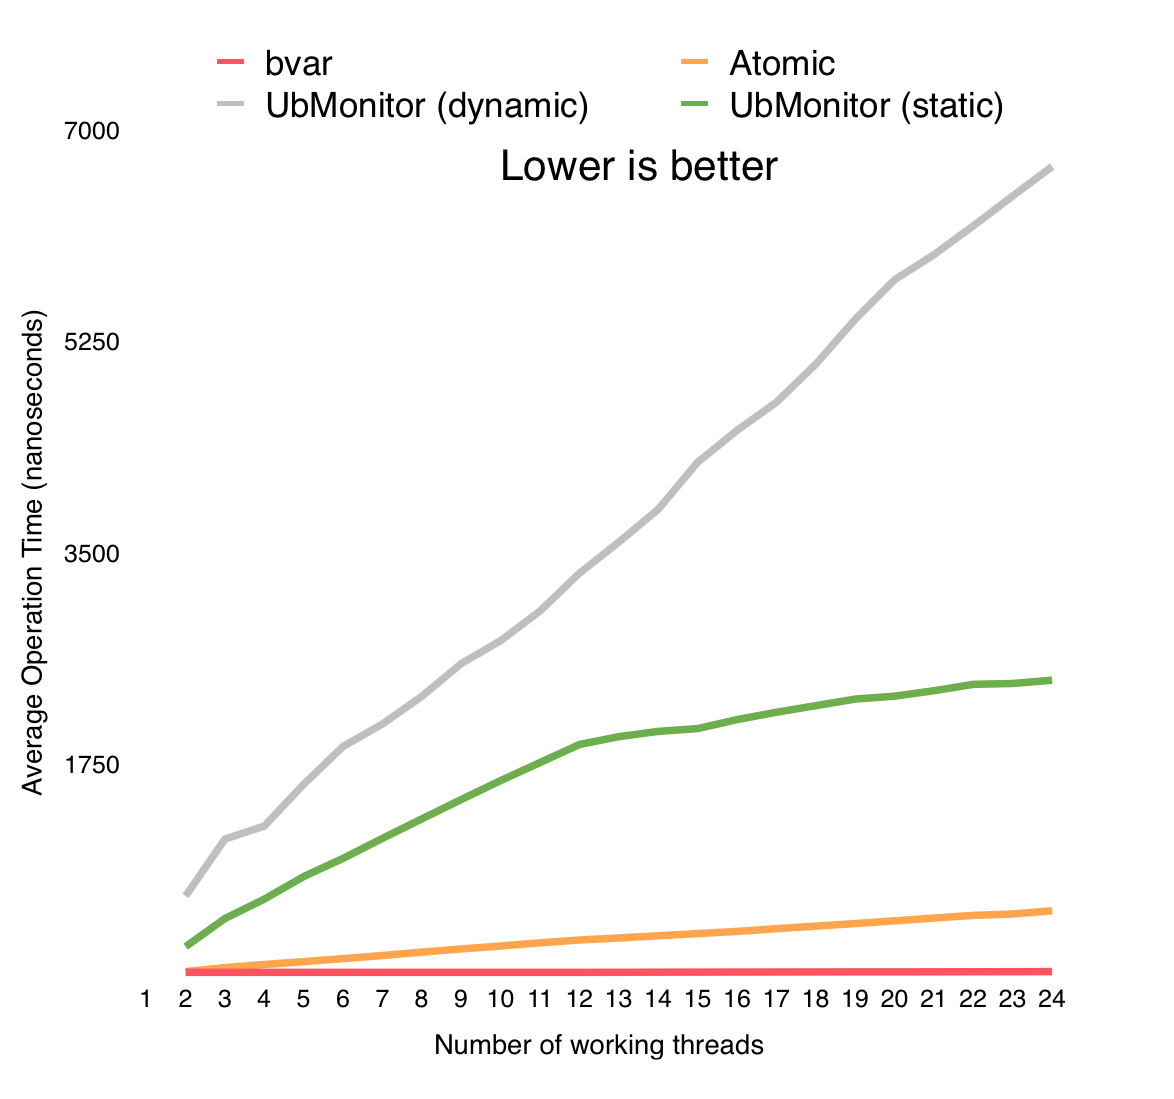
Following graph compares overhead of bvar, atomics, static UbMonitor, dynamic UbMonitor when they’re accessed by multiple threads simultaneously. We can see that overhead of bvar is not related to number of threads basically, and being constantly low (~20 nanoseconds). As a contrast, dynamic UbMonitor costs 7 microseconds on each operation when there’re 24 threads, which is the overhead of using the bvar for 300 times.
Adding new bvar
Read Quick introduction to know how to add bvar in C++. bvar already provides stats of many process-level and system-level variables by default, which are prefixed with process_ and system_, such as:
process_context_switches_involuntary_second : 14
process_context_switches_voluntary_second : 15760
process_cpu_usage : 0.428
process_cpu_usage_system : 0.142
process_cpu_usage_user : 0.286
process_disk_read_bytes_second : 0
process_disk_write_bytes_second : 260902
process_faults_major : 256
process_faults_minor_second : 14
process_memory_resident : 392744960
system_core_count : 12
system_loadavg_15m : 0.040
system_loadavg_1m : 0.000
system_loadavg_5m : 0.020
and miscellaneous bvars used by brpc itself:
bthread_switch_second : 20422
bthread_timer_scheduled_second : 4
bthread_timer_triggered_second : 4
bthread_timer_usage : 2.64987e-05
bthread_worker_count : 13
bthread_worker_usage : 1.33733
bvar_collector_dump_second : 0
bvar_collector_dump_thread_usage : 0.000307385
bvar_collector_grab_second : 0
bvar_collector_grab_thread_usage : 1.9699e-05
bvar_collector_pending_samples : 0
bvar_dump_interval : 10
bvar_revision : "34975"
bvar_sampler_collector_usage : 0.00106495
iobuf_block_count : 89
iobuf_block_count_hit_tls_threshold : 0
iobuf_block_memory : 729088
iobuf_newbigview_second : 10
New exported files overwrite previous files, which is different from regular logs which append new data.
Monitoring bvar
Turn on dump feature of bvar to export all exposed bvars to files, which are formatted just like above texts: each line is a pair of “name” and “value”. Check if there’re data under $PWD/monitor/ after enabling dump, for example:
$ ls monitor/
bvar.echo_client.data  bvar.echo_server.data

$ tail -5 monitor/bvar.echo_client.data
process_swaps : 0
process_time_real : 2580.157680
process_time_system : 0.380942
process_time_user : 0.741887
process_username : "gejun"
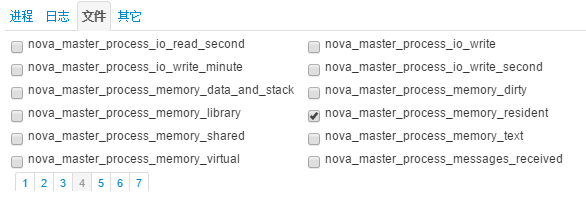
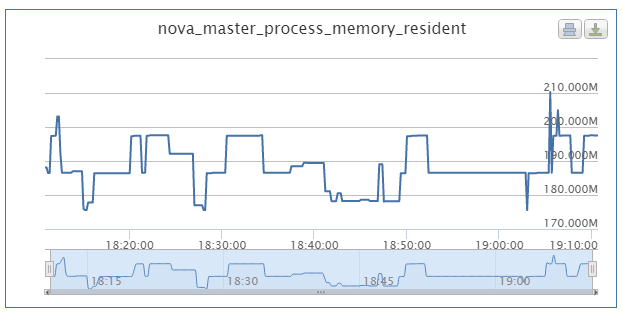
The monitoring system should combine data on every single machine periodically and merge them together to provide on-demand queries. Take the “noah” system inside Baidu as an example, variables defined by bvar appear as metrics in noah, which can be checked by users to view historical curves.
Export to Prometheus
To export to Prometheus, set the path in scraping target url to /brpc_metrics. For example, if brpc server is running on localhost:8080, the scraping target should be 127.0.0.1:8080/brpc_metrics.